You can display the tax groups on a sales invoice.
Steps
In Microsoft Word or Excel, go to the dox42 ribbon and select Data Map.
dox42 ribbon
The Data Map Designer window opens.
Select the D365 FSCM Report data source.
Select the Edit button.
The D365 FSCM Report Data Source window opens.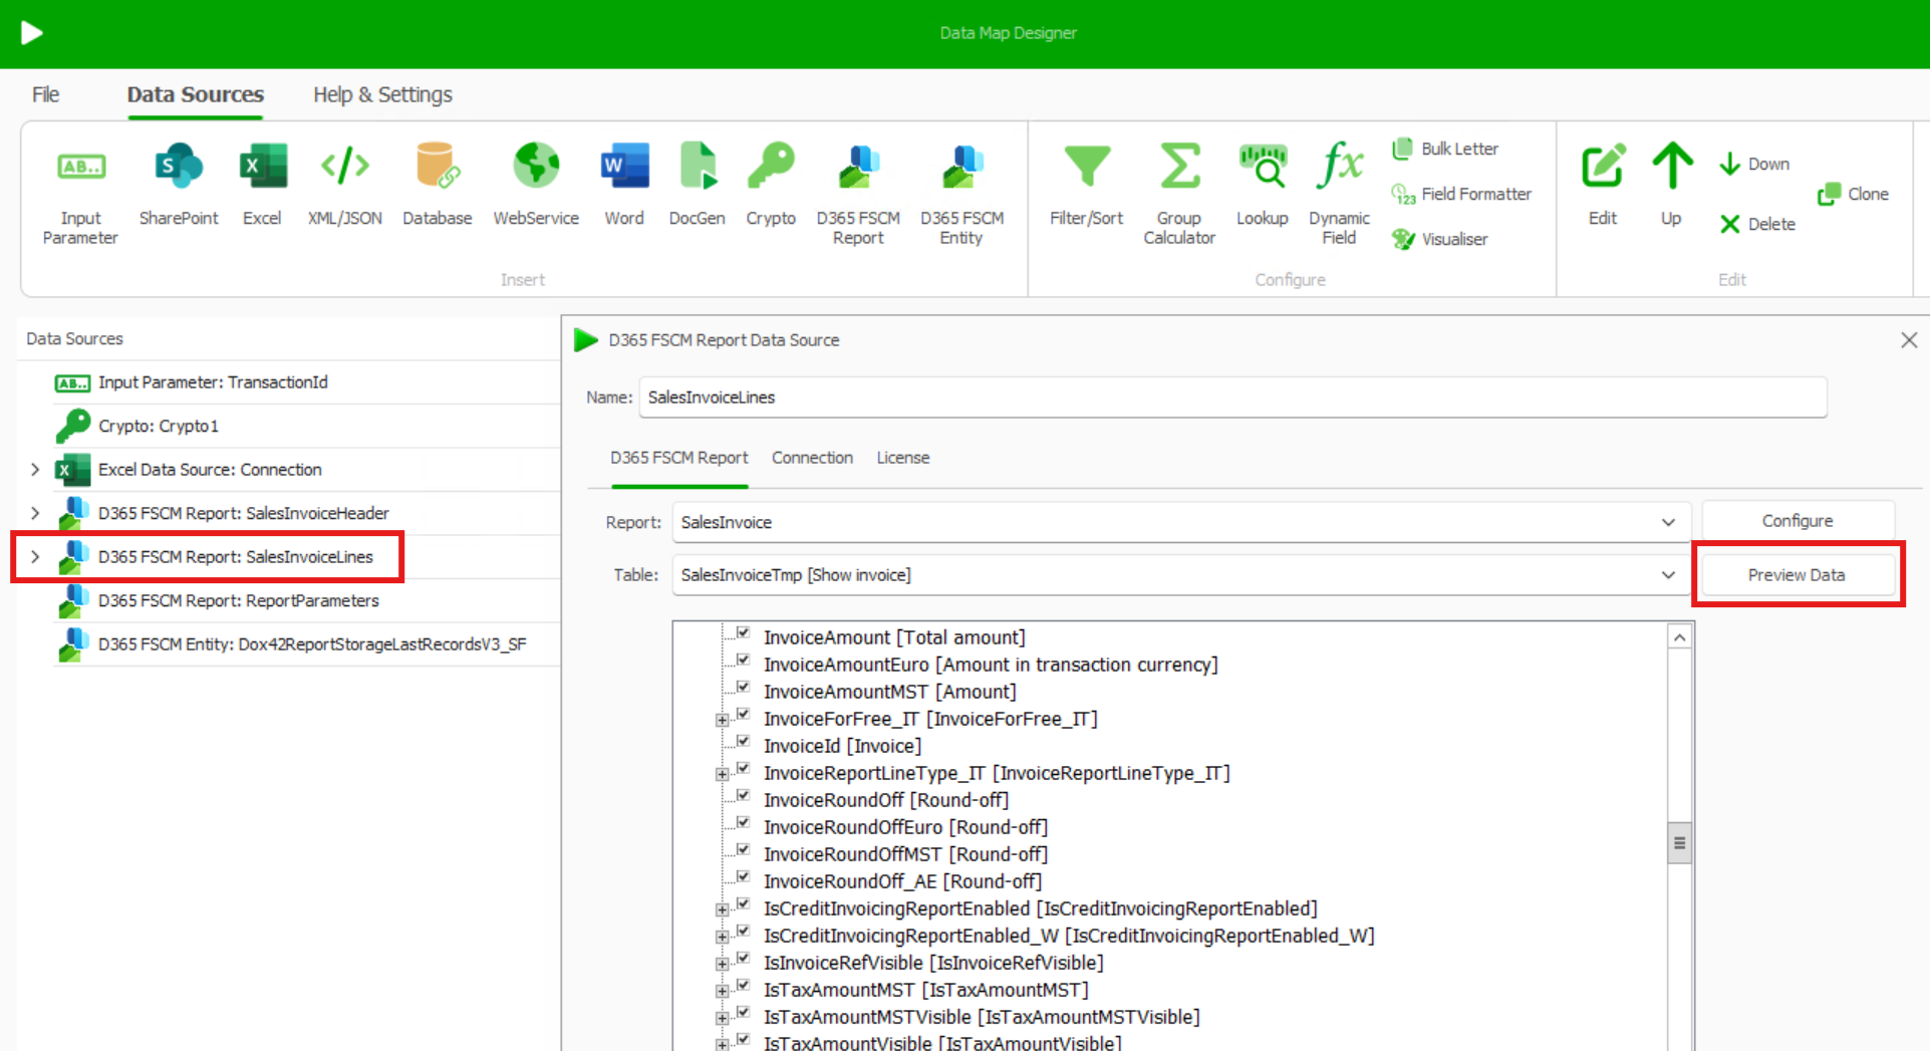
Select the Preview Data button and then select Next.
The data of the next report will be shown.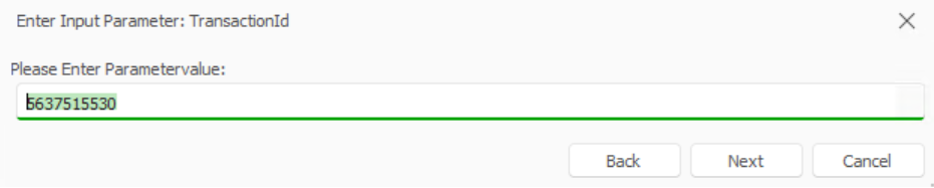
Look for the field which contains the tax group.
To clone the data source:
The data source needs to be cloned because a special filter is needed, which will then only displays the tax groups.Select the data source.
Select the Clone button.
A copy of the data source is created.
Select the copy and select the Filter/Sort button.
Insert the values as follows.
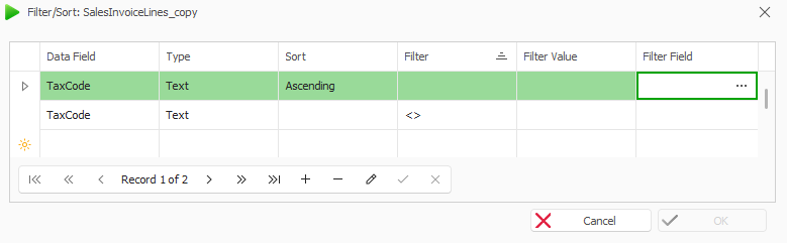
Setup of the data source filter
The “<>” stands for the filter value of “not empty”.Create a group calculator to sum up the amount of every tax group.
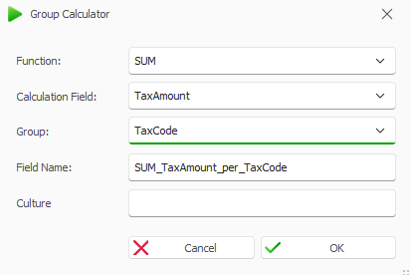
Configuration of the group calculator
Select OK.
Select File > Save to save the changes to the data map.
Result
Your document template can display the tax group.